
Wealth Tax Calculator
This tool quantifies the equivalent capital income tax rate (t*) of a wealth tax — the income-tax rate on capital that would produce the comparable economic outcome as living under a given wealth tax — and reports the required pre-tax return (ρ) investors would demand to compensate for the recurring expropriation risk. State and federal capital gains taxes are layered in optionally.
Calculator
Pick a jurisdiction, enter a wealth tax rate and a risk-free rate. Results update as you type.
Background
The recent interest in wealth taxes highlights the importance of clarifying their tradeoffs, since the absence of a familiar benchmark leads to misanchored judgments about their costs and benefits. The apparent simplicity of taxing accumulated assets conceals the effects these policies impose on economic behavior and property rights, ultimately trading short-term fiscal gains for long-term economic costs. For example, the "Zucman Tax," a 2 percent wealth tax in France and Washington state's recently proposed 1 percent wealth tax in the United States have gained traction by appealing to fairness and these taxes as a source of redistributive public sector revenue.
Surveys suggest that a non-trivial portion of the electorate would support a wealth tax levied on individuals with assets over a certain dollar threshold. However, extrapolation from that self-reported support generally rests on the assumption that citizens and business leaders are able to appropriately anchor the costs and benefits of a wealth tax, for which they do not have a comparable tax experience. The support for these measures therefore rests less on a concrete understanding of their incidence than on the perception that a wealth tax set at a seemingly low rate would impose minimal distortions, particularly when targeted at the wealthiest households. This disconnect between the political appeal of wealth taxes and the absence of a meaningful benchmark underscores the necessity of a framework that quantifies their true economic tradeoffs in a way that is relatable and tangible to a larger portion of citizens and policymakers.
This calculator provides that framework. For those interested in the theoretical foundation and detailed analysis behind these calculations, please refer to the accompanying academic paper (citation to paper).
Purpose
This calculator quantifies the equivalent capital income tax rate (t*) of a wealth tax. It addresses the question: What rate of income taxation on capital yields the same economic outcome as living under a wealth tax?
Adjusting for State and Federal Capital Gains Taxes
The calculator also allows for the application of capital gains rates by state and the federal tax on capital gains. It addresses: What rate of income taxation on capital yields the same economic outcome as living under a wealth tax, when adjusting for the state those gains are realized in?
Note: Capital gains consists of the top capital gains rate per selected state plus the top federal capital gains rate of 20% plus the Net Investment Income Tax (NIIT) of 3.8% applied on all investment income exceeding $250,000 for taxpayers married filing jointly ($125,000 filing separately).
Required Returns
Beyond calculating the equivalent capital income tax rate, the calculator also determines the required pre-tax return on assets (ρ) that investors would demand to compensate for the expropriation risk created by a wealth tax combined with the existing federal and state capital gains tax rates. This metric is critical for communicating investment tradeoffs to owners of capital in the adopting jurisdiction. The required return calculations support economic theory and historical experience that substantial industry outmigration becomes likely, as investors seek jurisdictions where their capital can earn competitive after-tax returns without the recurring burden of wealth confiscation.
Real-Life Wealth Taxes and Proposals
Actual wealth taxes and proposals you can test in the calculator above:
| Wealth tax | Top wealth tax rate (θ) |
|---|---|
| Norway's "Formuesskatt" | 1.1% |
| Colombia's "Impuesto al Patrimonio" | 1.5% |
| Spain's "Impuesto sobre el Patrimonio" | 3.5% |
| Switzerland | * |
Note: Switzerland levies wealth taxes at the canton and municipal levels.
| Proposal | Wealth tax rate (θ) |
|---|---|
| State of Washington's proposed wealth tax | 1% |
| France's proposed "Zucman Tax" | 2% |
| Federal "Make Billionaires Pay Their Fair Share Act" | 5% |
| Bernie Sanders' proposed wealth tax top bracket | 8% |
Understanding the Calculations
For those interested in the mathematical framework behind the calculator, this section explains the two key formulas used.
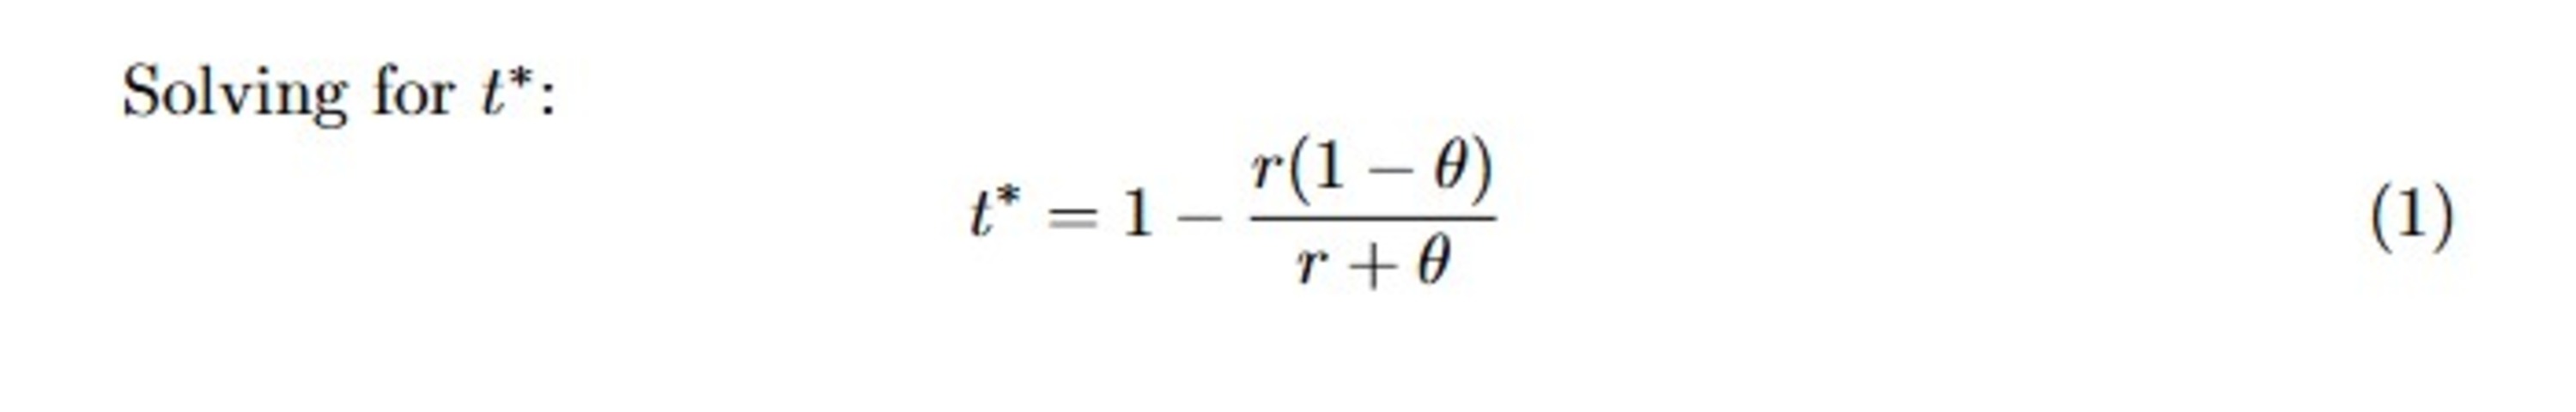
Equivalent Capital Income Tax Rate (t*)
The first calculation determines what rate of capital income taxation produces the same economic outcome as a wealth tax. This equivalence is captured by the following formula:
Where:
- t* = the equivalent capital income tax rate
- θ (theta) = the wealth tax rate
- r = the risk-free rate of return
This formula shows that even a seemingly small wealth tax translates into a much larger effective tax on capital income. When combined with existing state and federal capital gains taxes, the total tax burden can approach or exceed revenue-maximizing levels.
Required Return Analysis (ρ)
The second calculation determines the pre-tax return that investors must demand to compensate for the expropriation risk created by a wealth tax:
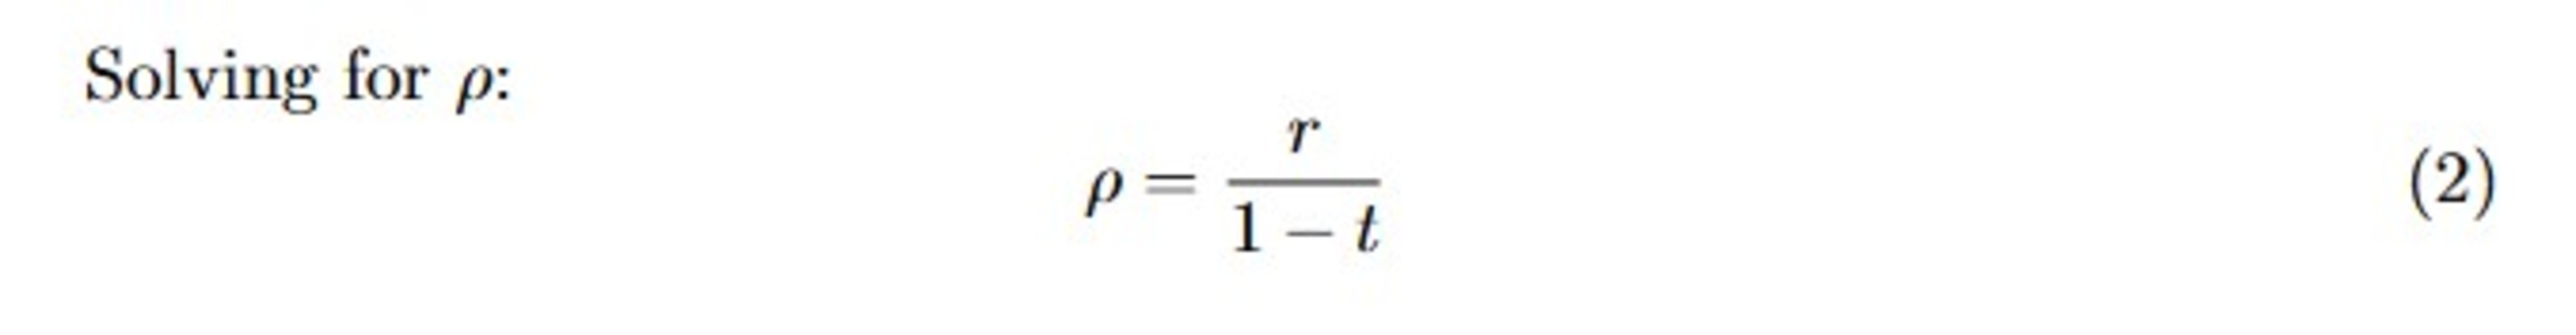
Where:
- ρ (rho) = the required pre-tax rate of return
- r = the risk-free rate of return
- t = the combined capital income tax rate (t* plus existing capital gains taxes)
This formula reveals how wealth taxes fundamentally alter investment incentives by requiring higher returns to compensate for the recurring claim on accumulated assets. The insecurity of property rights generated under a wealth tax regime can functionally deter internal and external direct investment. For example, the proposed federal "Make Billionaires Pay Their Fair Share Act" — a 5 percent wealth tax — would be equivalent to a 52.5 percent capital income tax rate. Combined with the 23.8 percent federal long-term capital gains rate (20 percent top statutory rate plus 3.8 percent NIIT), the total combined tax on capital income reaches 76.3 percent. Investors would demand a 21.1 percent before-tax return — four times the risk-free rate — to compensate for the expropriation risk. Compared to the total market return on invested capital of about 7.64 percent, nearly half of publicly traded industry asset classes have a lower return on invested capital, serving as a substantial barrier to capital investment in the United States.
For a complete theoretical derivation and policy analysis, please refer to the accompanying academic paper.
Data sources: capital gains tax rates by jurisdiction
The capital gains rates used in the calculator dropdown are sourced as follows.
| City | Top Capital Gains Rate | Source |
|---|---|---|
| New York City | 3.4% | N.Y. Tax Law § 1304 |
| Portland, Oregon | 4.0% | Metro Code § 7.06.040; Multnomah County Code § 11.512 |
| International | Capital Gains | Source |
|---|---|---|
| France — Financial Assets | 30% | Service-Public.fr |
| France — Real Estate (under 22 years) | 36.2% | Service-Public.fr |
The academic content, calculator methodology, and associated research are © 2025 William Dougan and Benjamin Jaros. For inquiries regarding the research or calculator, please contact: hooverfpi@stanford.edu.